Best Greyhound Betting Sites – Bet on Greyhounds in 2026
Loading...
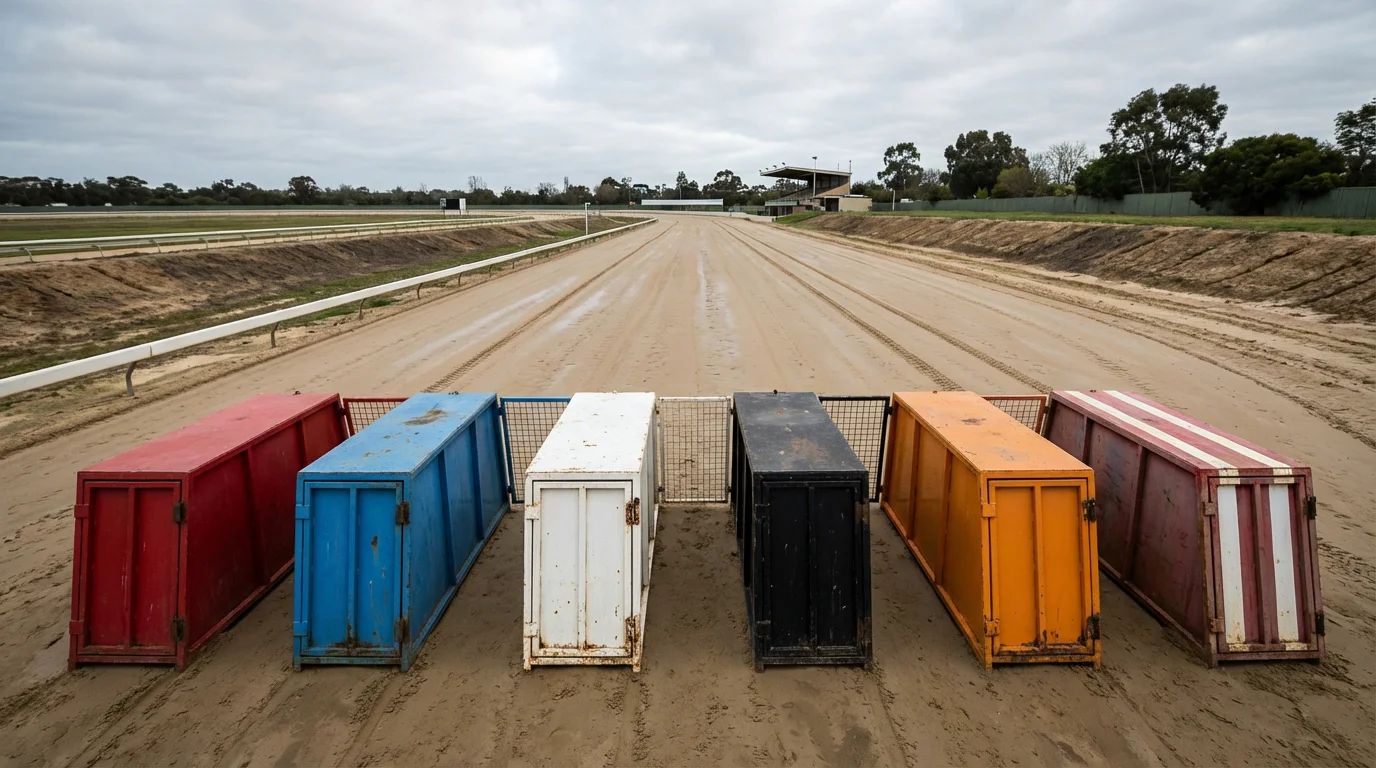
The Invisible Advantage
Every greyhound track has a trap bias. Not every track admits it, not every punter accounts for it, and not every bookmaker prices it in — but the numbers don’t lie. Across a meaningful sample of races, certain traps at certain tracks produce winners at a rate that deviates significantly from the expected one-in-six. That deviation isn’t random. It’s structural, and it’s driven by the physical characteristics of the track itself.
Trap bias is one of the most reliable patterns in greyhound racing, precisely because it’s rooted in geometry and physics rather than the variable performance of individual dogs. Dogs come and go, form fluctuates, grades shift — but the distance from trap 1 to the first bend doesn’t change, the radius of the first turn doesn’t change, and the advantage of the shortest arc through that turn doesn’t change. Understanding what causes trap bias, how to identify it, and when to exploit it gives bettors a foundation that’s more stable than any other form factor.
This guide covers the mechanics behind trap bias, the methods for identifying biased tracks, the practical application of bias data in your betting, and — critically — the situations where trap bias data can mislead.
What Causes Trap Bias
Trap bias is fundamentally a product of track geometry. The position of the starting traps relative to the first bend determines how much advantage an inside draw carries. The shorter the run from the traps to the first turn, the greater the inside bias — because dogs drawn in traps 1 and 2 reach the bend first and have the shortest arc to navigate. Dogs drawn outside need either superior break speed or a longer straight to overcome the positional disadvantage before the track curves.
The run-to-first-bend measurement is the single most important variable in predicting trap bias. At circuits where this distance is short — 50 to 70 metres — the inside traps dominate because the field hits the first bend before the dogs have time to sort out their positions. The inside dog arrives first simply because it has less ground to cover, and once it claims the rail, the race often follows its course. At tracks with longer run-ups — 100 metres or more, as at Doncaster — the bias is diluted because all six dogs have sufficient straight running to establish themselves before the bend.
Track circumference is the second factor. A smaller circumference means tighter bends, which amplify the advantage of an inside running line. A wider circumference produces gentler bends where the difference between an inside and outside arc is less pronounced. Doncaster’s 438-metre circumference (BettingOdds.com) is on the larger end for UK tracks, which is one reason its trap bias is moderate rather than extreme.
The racing surface also contributes. Sand tracks — including Doncaster — can develop inconsistencies across the width of the running surface. If the inside of the track is more compacted or better maintained than the outside, the inside running line offers a firmer, faster surface. Conversely, if the inside rail area is deeper or softer — perhaps from repeated use — dogs running wider may actually have a marginal surface advantage. Track maintenance practices, including how frequently the surface is harrowed and re-levelled, affect this variable from meeting to meeting.
Hare type and rail position play a minor role. The mechanical hare runs on either an inside or outside rail depending on the track. The position of the hare can influence running lines, particularly for dogs that chase the hare visually rather than running their own race. At tracks where the hare runs on the inside rail, dogs drawn inside tend to have a clearer sightline and may respond with more urgency from the traps.
Finally, the number of bends in the race amplifies or moderates bias. Two-bend sprint races show the strongest trap bias because there are fewer opportunities for positional changes. Four-bend races moderate the bias. Six-bend stayers races flatten it further. Each additional bend gives wider-drawn dogs another opportunity to gain position or find their running line, which dilutes the initial geometric advantage of the inside traps.
How to Identify Biased Tracks
Trap bias is identified statistically — by comparing the actual win rate per trap against the expected win rate (16.7 per cent in a standard six-dog race) over a sufficient sample. The sample size matters. Trap win rates from 50 races will show apparent biases that are actually random variation. From 500 or more races at a given distance, genuine biases become statistically stable.
The data is available from several sources. Timeform publishes trap statistics for every UK track, broken down by distance. The Racing Post includes trap stats in its track guides. Some specialist greyhound data services provide more granular breakdowns, including trap stats by grade and by time period. For Doncaster, any of these sources will give you a current picture of how each trap performs over each distance.
When reviewing trap statistics, always segment by distance. A track’s overall trap stats — aggregated across sprints, standard distance, and stayers — are a blunt instrument. The bias profile typically differs between distances at the same track because the number of bends, the trapping position, and the race dynamics change. At Doncaster, trap 1 is dominant at 275m but only moderately advantaged at 483m, and the stayers distances show no meaningful bias at all. Using the aggregate number misrepresents every individual distance.
Look for deviations of three percentage points or more from the 16.7 per cent baseline as a threshold for actionable bias. If trap 1 at a particular distance wins 20 per cent or more of races across a sample of 200+, that’s a genuine structural advantage worth factoring into your assessments. Deviations of one or two per cent are within the range of random variation and shouldn’t carry significant weight.
Track changes can alter bias profiles. If a circuit undergoes resurfacing, modifies its trapping positions, or changes the run-to-first-bend distance, the historical trap data may no longer apply. After any significant track alteration, discount the pre-change data and wait for a fresh sample of at least 100 races at the affected distance before drawing conclusions.
Exploiting Trap Bias in Betting
The practical exploitation of trap bias is simpler than most punters expect. It’s not about blindly backing the favoured trap — it’s about adjusting your confidence in each dog based on whether its trap draw aligns with or works against the track’s structural bias.
Start with your normal form assessment. Evaluate each dog in the race on form, grade, sectional times, running comments, and running style. Arrive at a provisional ranking of the field based on ability. Then apply the trap bias data as a final adjustment.
If your top-ranked dog is drawn in a favoured trap, your confidence increases. The form says it’s the best dog; the trap bias data says the draw helps. Back it with your full intended stake. If your top-ranked dog is drawn in a penalised trap, reduce your confidence accordingly. The form is still good, but the draw works against it. Consider reducing your stake, looking for an alternative selection that combines decent form with a favourable draw, or passing the race entirely.
The most profitable application of trap bias data is in identifying situations where the market hasn’t fully accounted for the draw. Bookmakers do adjust their prices for trap draw to some extent, but the adjustment is often insufficient, particularly at tracks where the bias is strong. A dog with moderate form drawn in a dominant trap may be priced as a 5/1 shot when its real win probability — form plus trap advantage — is closer to 3/1. That gap is value, and it’s created by the market underweighting the structural advantage of the draw.
Conversely, dogs drawn against the bias are often underpriced. The market sees decent form and offers 3/1 on a dog drawn in trap 6 at a track with a strong inside bias. The form justifies 3/1, but the draw doesn’t — the true price should be longer. Opposing these dogs, either by not backing them or by laying them on the exchange, is the other side of the trap-bias value equation.
When Trap Bias Data Misleads
Trap bias is real, but it’s not a cheat code. The data tells you about averages — how a trap performs across hundreds of races with hundreds of different dogs. Any individual race can deviate from the average, and several specific situations cause trap bias data to mislead rather than inform.
The first is small-sample overconfidence. If you’re looking at trap stats from the last 30 races at a particular distance, the data is too thin to be reliable. Genuine bias requires at least 200 races to separate signal from noise. Short-term samples can show dramatic biases that disappear when the sample grows — that’s randomness masquerading as structure.
The second is ignoring the dog in the trap. Trap stats measure the box, not the runner. If a trap has a strong historical win rate, it’s partly because the racing manager tends to place fast-breaking railers in that trap — not because the box itself confers an advantage independent of the dog. When a slow-breaking wide runner is drawn in trap 1 (perhaps due to a grade change or a quirk of the draw), the trap stat is irrelevant because the dog’s running style negates the positional advantage.
The third is conflating track-level data with race-level reality. A track might show a mild overall bias toward inside traps, but on a given day, the inside rail might be riding slower due to surface conditions. Trap bias data doesn’t adjust for daily going variation. If the track is watered on one side or the inside line is churned up from a previous meeting, the bias may not hold for that session.
Bias Is a Tool, Not a Strategy
Trap bias is a structural feature of every greyhound track, and at circuits with strong biases, it’s one of the most reliable data points available. But it’s a tool for adjustment, not a strategy for selection. It tells you which traps have a geometric advantage across volume — it doesn’t tell you which dog will win this race. Use it to refine assessments that are already built on form, grade, and sectional analysis. The bias sharpens the picture. It was never meant to replace it.